Select and Manage Energy Projects with Clarity
Providing services for new and existing electric power projects, including analytical tools, project management, and procurement evaluation.

Our NodeScore tool provides valuable context to find an ideal project location by type of energy resource as well as measure a project’s performance against reference projects. Currently available for CAISO EIM resources, search by node and view the Wattfolio NodeScore (WNS) for the location as well as the performance by resource (such as the Solar WNS).
NodeScore™
Energy procurement done right .
We deliver energy node analytics to support smarter siting and procurement decisions. Our NodeScore tool cuts through the noise to reveal how CAISO nodes stack up against alternatives and market averages.
Uncover new insights
Wattfolio’s NodeScore tool helps make sense of energy data with several features:
Smart Scoring
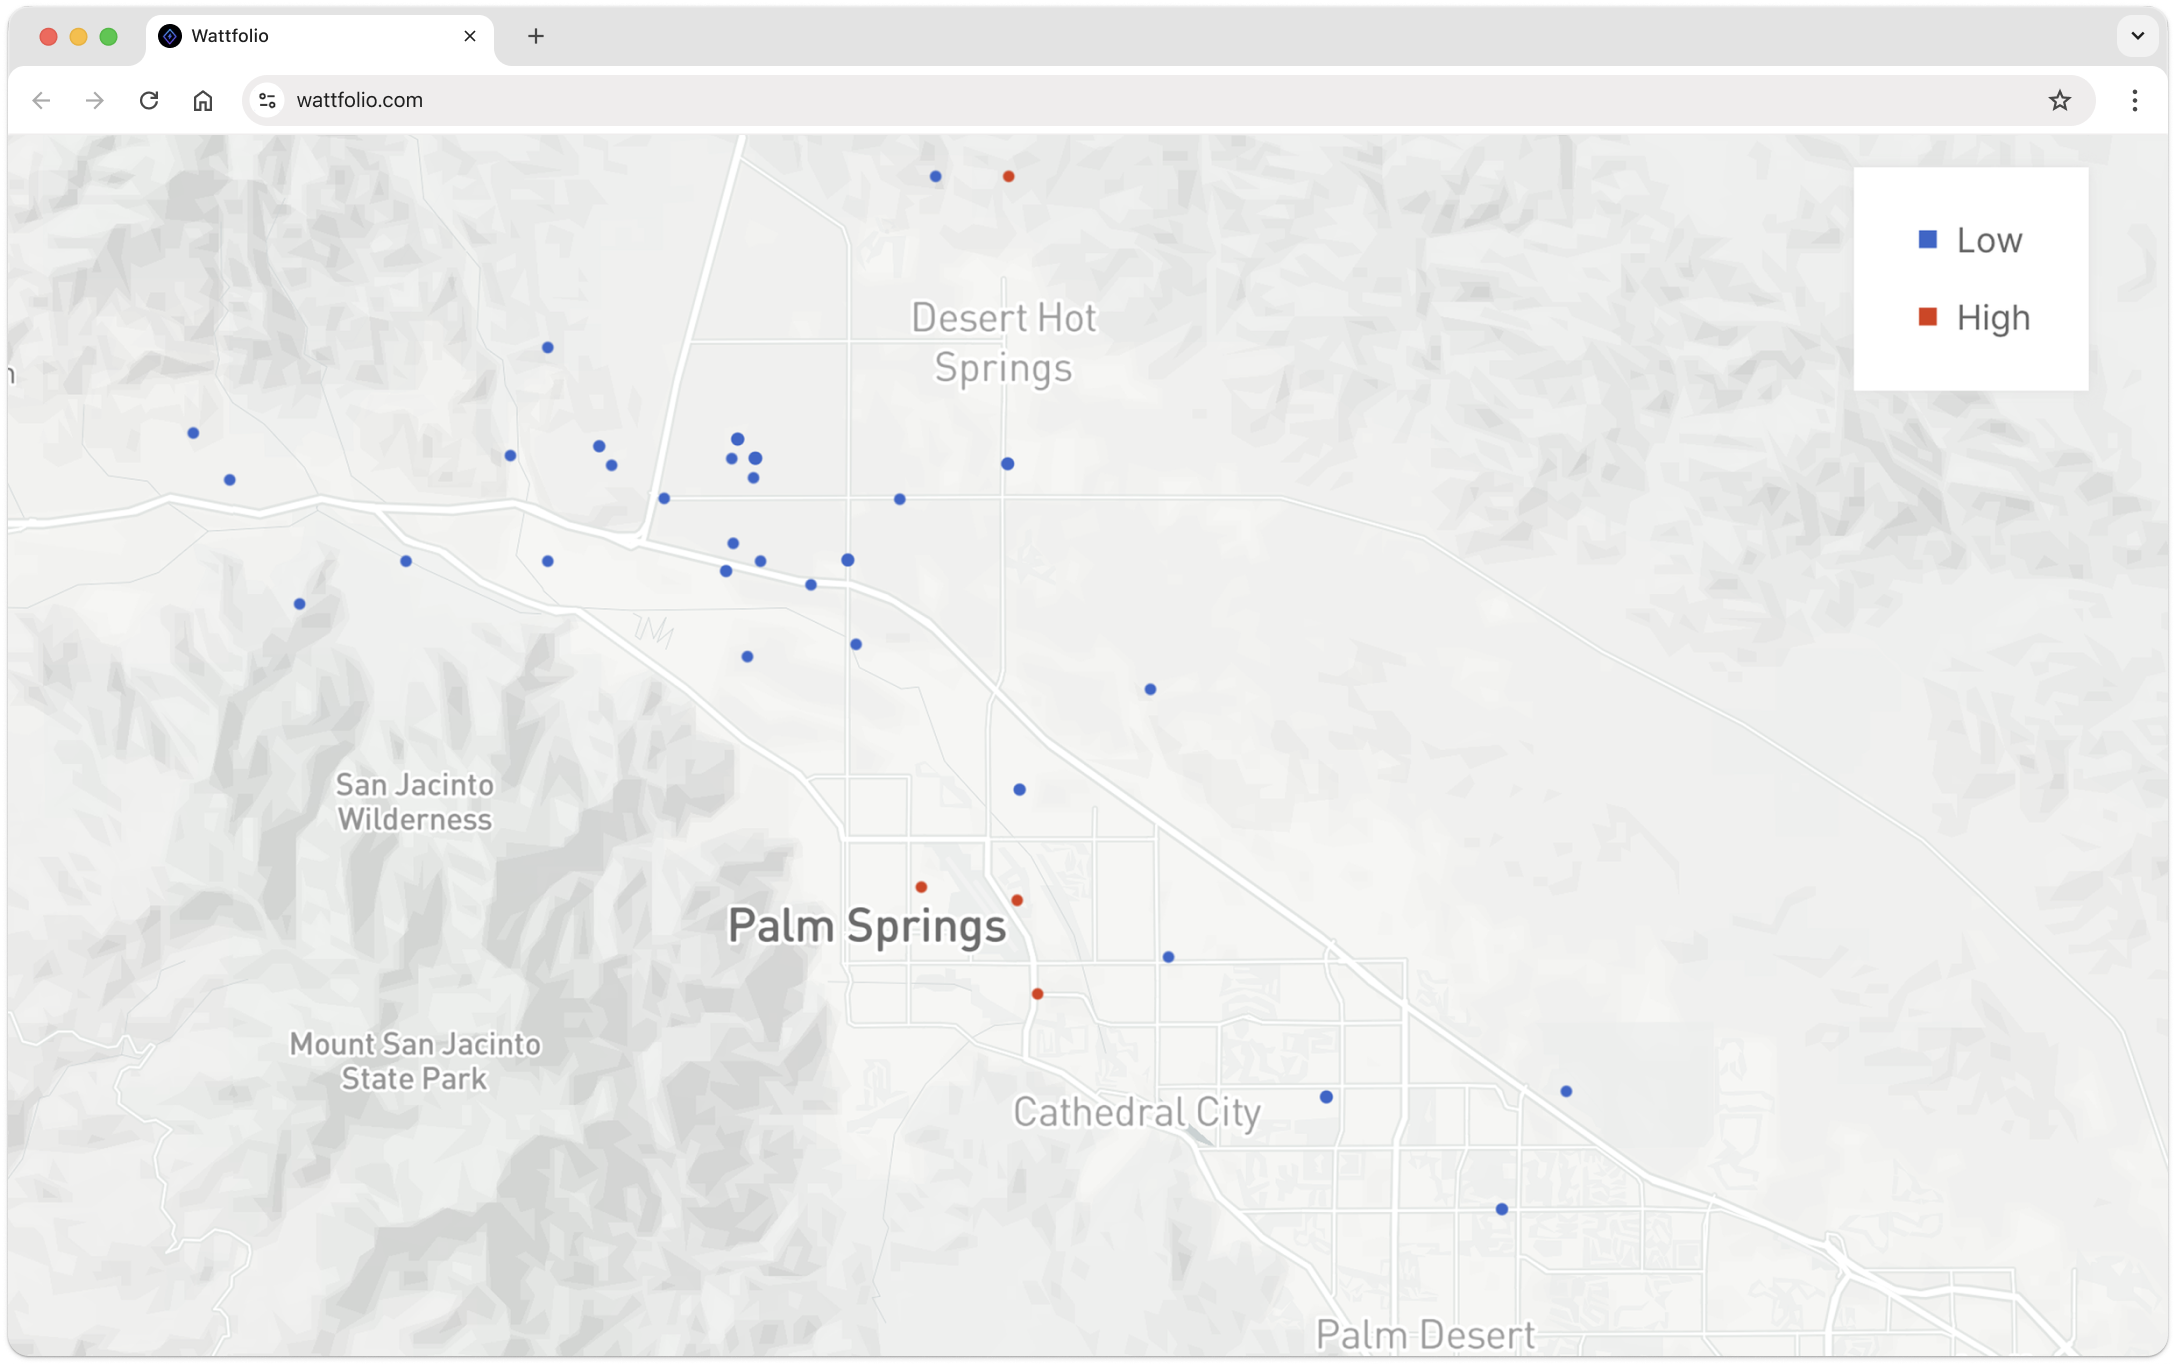
Wattfolio visualizes intelligent node scoring across regions, to help with scanning and understanding of the advantages and disadvantages of different locations. For example within Southern California, you could compare various Victorville-area nodes for solar use COTWDPGE_1_N001 (Solar NodeScore 84.5) against RDWAY_7_N002 (Solar NodeScore 78.84). Within Northern California, compare the Fresno area nodes for solar use BIOMSJCT_6_GN001 (Solar NodeScore 81.26) and KERMAN_6_N001 (Solar NodeScore 84.44).
Multi-Region Comparison
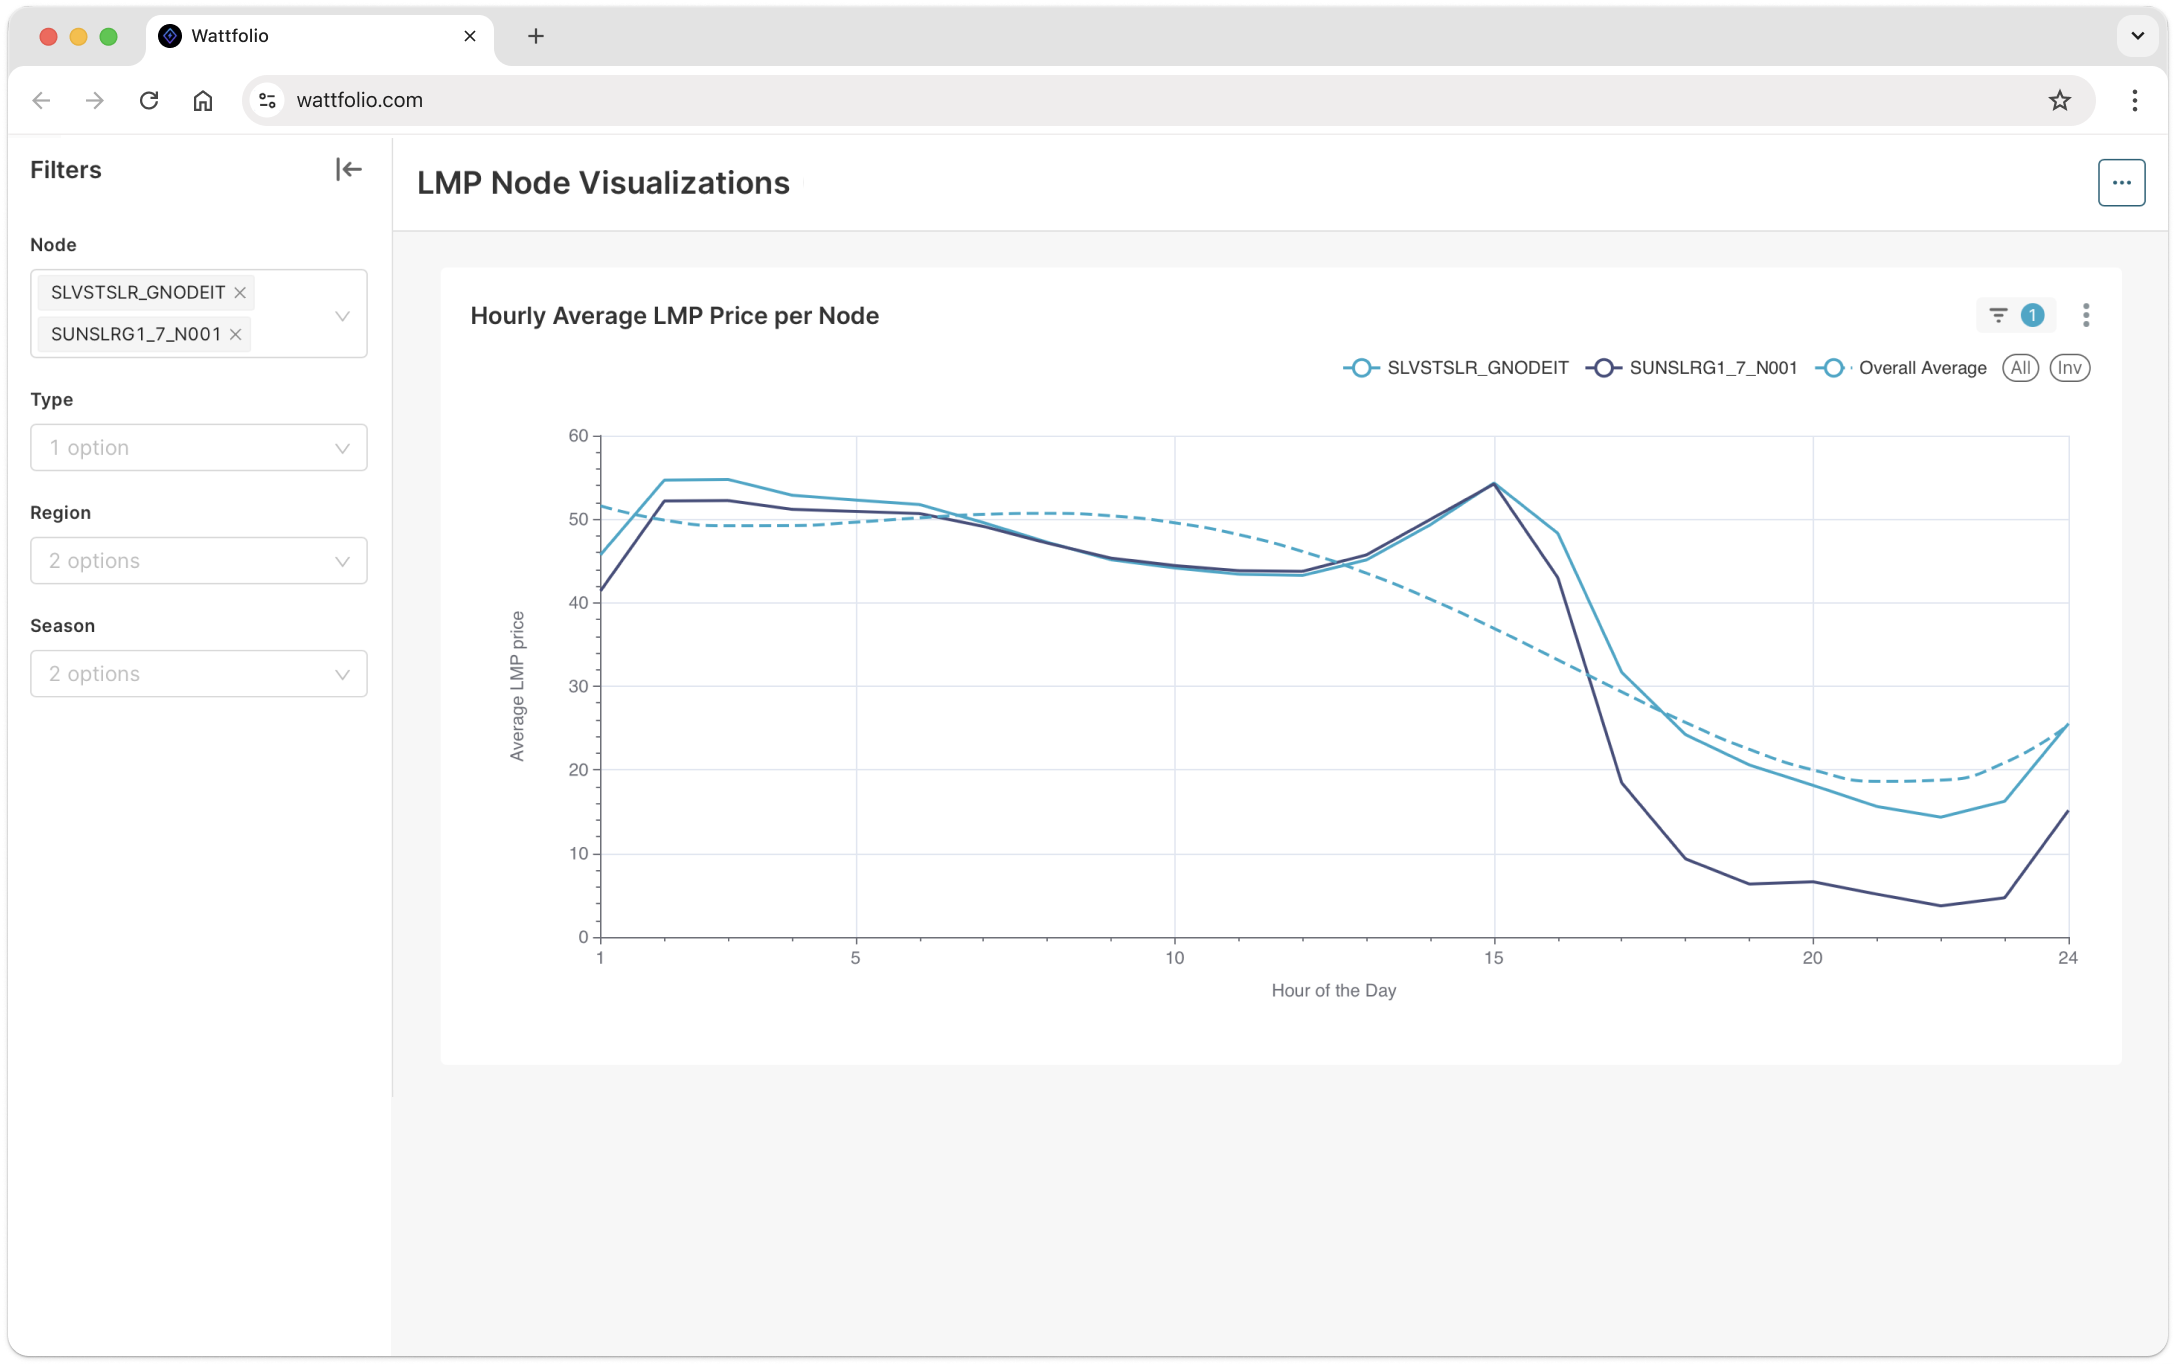
Understand trends and history across different regions. For example, in the Nevada’s border area (CAISO BAA and non-CAISO BAA) compare SLVSTSLR_GNODEIT (Solar NodeScore 79.24) against SUNSLRG1_7_N001 (Solar NodeScore 75.39). For Arizona’s Yuma area, compare AGUCALG1_7_B1 (Solar NodeScore 70.59) against SLNX_LNODEUX2 (Solar NodeScore 78.74).